The Weather at Howhill
12 September 2025
Temperature
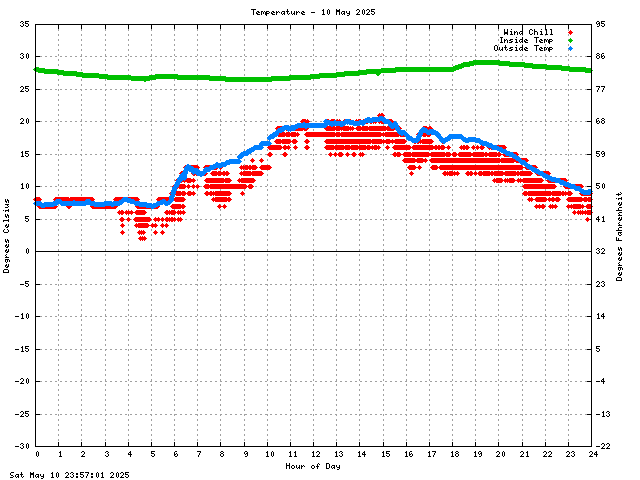
The temperature graph shows the inside and outside temperature and the wind-chill. The wind-chill is calculated in 1° steps so this has a stripy appearance when compared to the 0.1° resolution of the temperature graphs.
Humidity
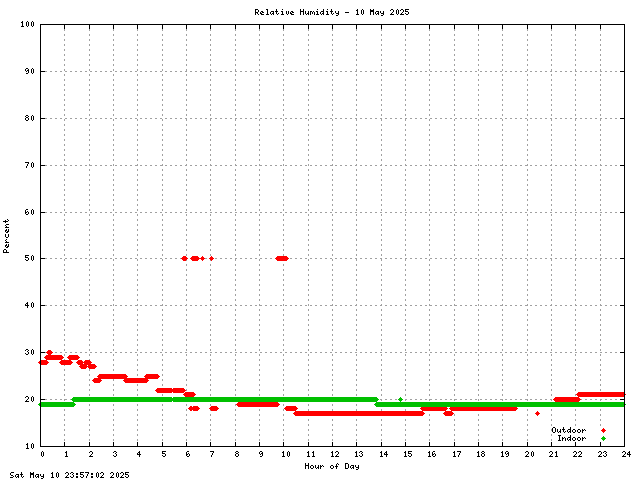
The humidity graph shows both inside and outside humidity. The highest reading will never go above the upper limit of the instrumentation at 97%. There is a similar lower limit of 10%RH but I doubt it will ever get that dry here.
Barometric Pressure
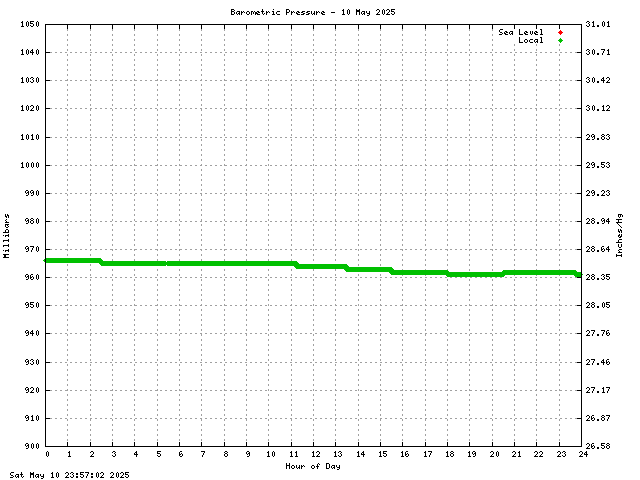
The barometric pressure graph plots the local pressure and the corrected to sea level pressure. The slightly bumpy appearance is down to the 1mb resolution.
Wind Speed
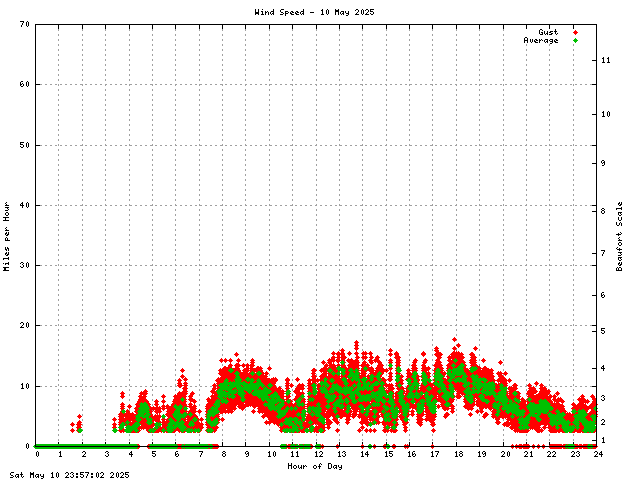
The wind speed graph shows both the average and gust wind speed. The sampling interval for the gust reading is 5 seconds and for the average reading 1 minute.
The left hand axis is mph and the right hand is Beaufort Scale. The Beaufort scale only applies to the average speed of the wind, gust speeds should use a proper speed unit, mph, knots etc.
If the wind speed is less than about 2.5mph it is below the measuring range of the instrumentation. This produces the blank band in the graphs just above zero.
During the winter prolonged periods with no apparent wind might be due to the anemometer being frozen. Check the external temperature.
Wind Direction
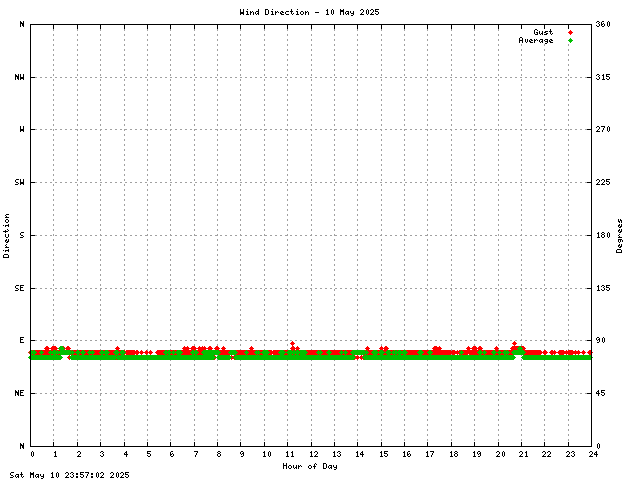
The wind direction graph plots wind direction against time. The right hand axis has North top and bottom with South in the middle. Both gust and average wind directions are plotted.
The instrumentation lacks resolution just West of North. The specification has a resolution of ±18° in the range 347° to 0°. The rest of the range is ±8°. This lack of resolution manifests itself as stripes in that area of the graph.
The sampling interval for the gust reading is 5 seconds, for the average reading 1 minute.
During the winter prolonged periods with no apparent change of wind direction might be due to the wind vane being frozen. Check the external temperature.
Rain Fall
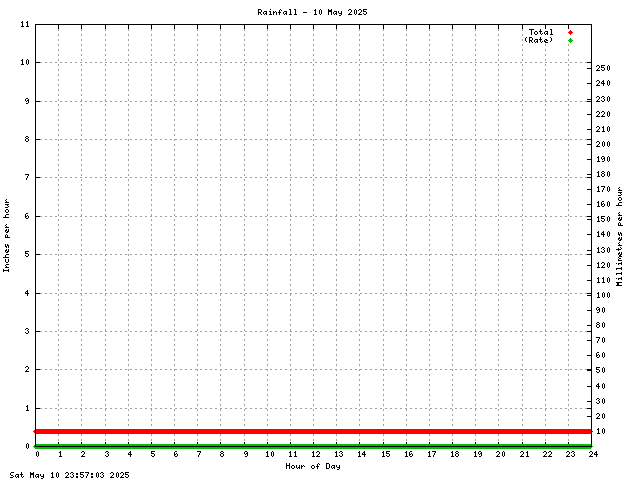
The rain graph shows both the monthly accumulated rainfall and the rate at which rain has fallen. The instrumentation is of the "tipping bucket" type and is thus a bit coarse (0.04inches or 1mm) in it's measurement and may fail to detect small amounts of precipitation. This also explains the stripey appearance of the graph.
The accumulated rainfall has to be manually reset on the weather station, so a dramatic drop will appear when this reset is performed.
| Howhill Weather |

 This page is standards compliant |
Updated: Sat 13 Sep 2025, 00:57 BST |